McDermott+ is pleased to bring you Regs & Eggs, a weekly Regulatory Affairs blog by Jeffrey Davis. Click here to subscribe to future blog posts.
February 26, 2026 – On February 13, 2026, the “DOGE” team within the US Department of Health and Human Services (HHS) released the largest public dataset of Medicaid provider spending data in department history. It is the first dataset posted on HHS’s open data platform. HHS DOGE stated that this release will enable detection of “large scale” fraud, citing recent enforcement actions such as the autism-related fraud case in Minnesota. The McDermott+ team downloaded the full dataset (10 GB and more than 227 million rows!) and is conducting an independent analysis. I’m bringing in my colleague Anthony Livshen to help me:
For more on this topic, listen to our Health Policy Breakroom podcast.
First, a basic question: what’s in the dataset?
HHS reports that the data contains “provider-level Medicaid spending data aggregated from outpatient and professional claims with valid Healthcare Common Procedure Coding System (HCPCS) codes, covering January 2018 through December 2024.”
Each row represents a unique combination of:
For each combination, the dataset includes:
This dataset is limited in scope. It includes professional and outpatient services with HCPCS codes but does not include:
The data is sourced from the Transformed Medicaid Statistical Information System (T-MSIS), the Centers for Medicare & Medicaid Services’ (CMS’s) national Medicaid and Children’s Health Insurance Program reporting system. States are required to submit monthly files, but HHS explicitly notes that T-MSIS data are only as accurate and complete as the data submitted by each state.
HHS has characterized this release as historic. Medicaid is the largest health insurer in the United States by enrollment, and for the first time HHS has publicly released provider-level service volume in Medicaid. Previously, accessing Medicaid claims data required CMS approval under a T-MSIS data use agreement through “ResDAC,” which is a lengthy and expensive process. In other words, data access has not been free and has taken significant time and effort to obtain.
HHS believes that this newly available Medicaid data can be used to increase public transparency and enable easier fraud detection. The data also increases reputational exposure for providers whose billing patterns may now be publicly scrutinized, regardless of whether those patterns reflect fraud, business growth, coding practices, or structural state differences.
The dataset creates meaningful new opportunities to evaluate Medicaid provider service patterns. The data enables analyses such as benchmarking provider billing patterns for specific services, assessing market concentration, and identifying shifts in service mix over time.
While unprecedented in scope, the dataset has important structural limitations.
Suppression of low volume claims
As with other public HHS datasets, rows with fewer than 12 claims are excluded to protect beneficiary privacy (interestingly, the standard in Medicare data is typically blinding values fewer than 11 claims).
This exclusion limits users’ ability to analyze providers that bill low volumes of particular services.
Likely incompleteness in 2024
Although HHS states the dataset spans January 2018 through December 2024, M+ analysis indicates that 2024 data are likely incomplete. When mapping total monthly paid amounts across the full timespan, total dollars drop sharply in November and December 2024. This pattern strongly suggests lagged or incomplete state submissions. This is consistent with the fact that 2024 T-MSIS analytic files available through ResDAC are currently marked as “preliminary.”
Therefore, users may want to view the 2024 data as incomplete.
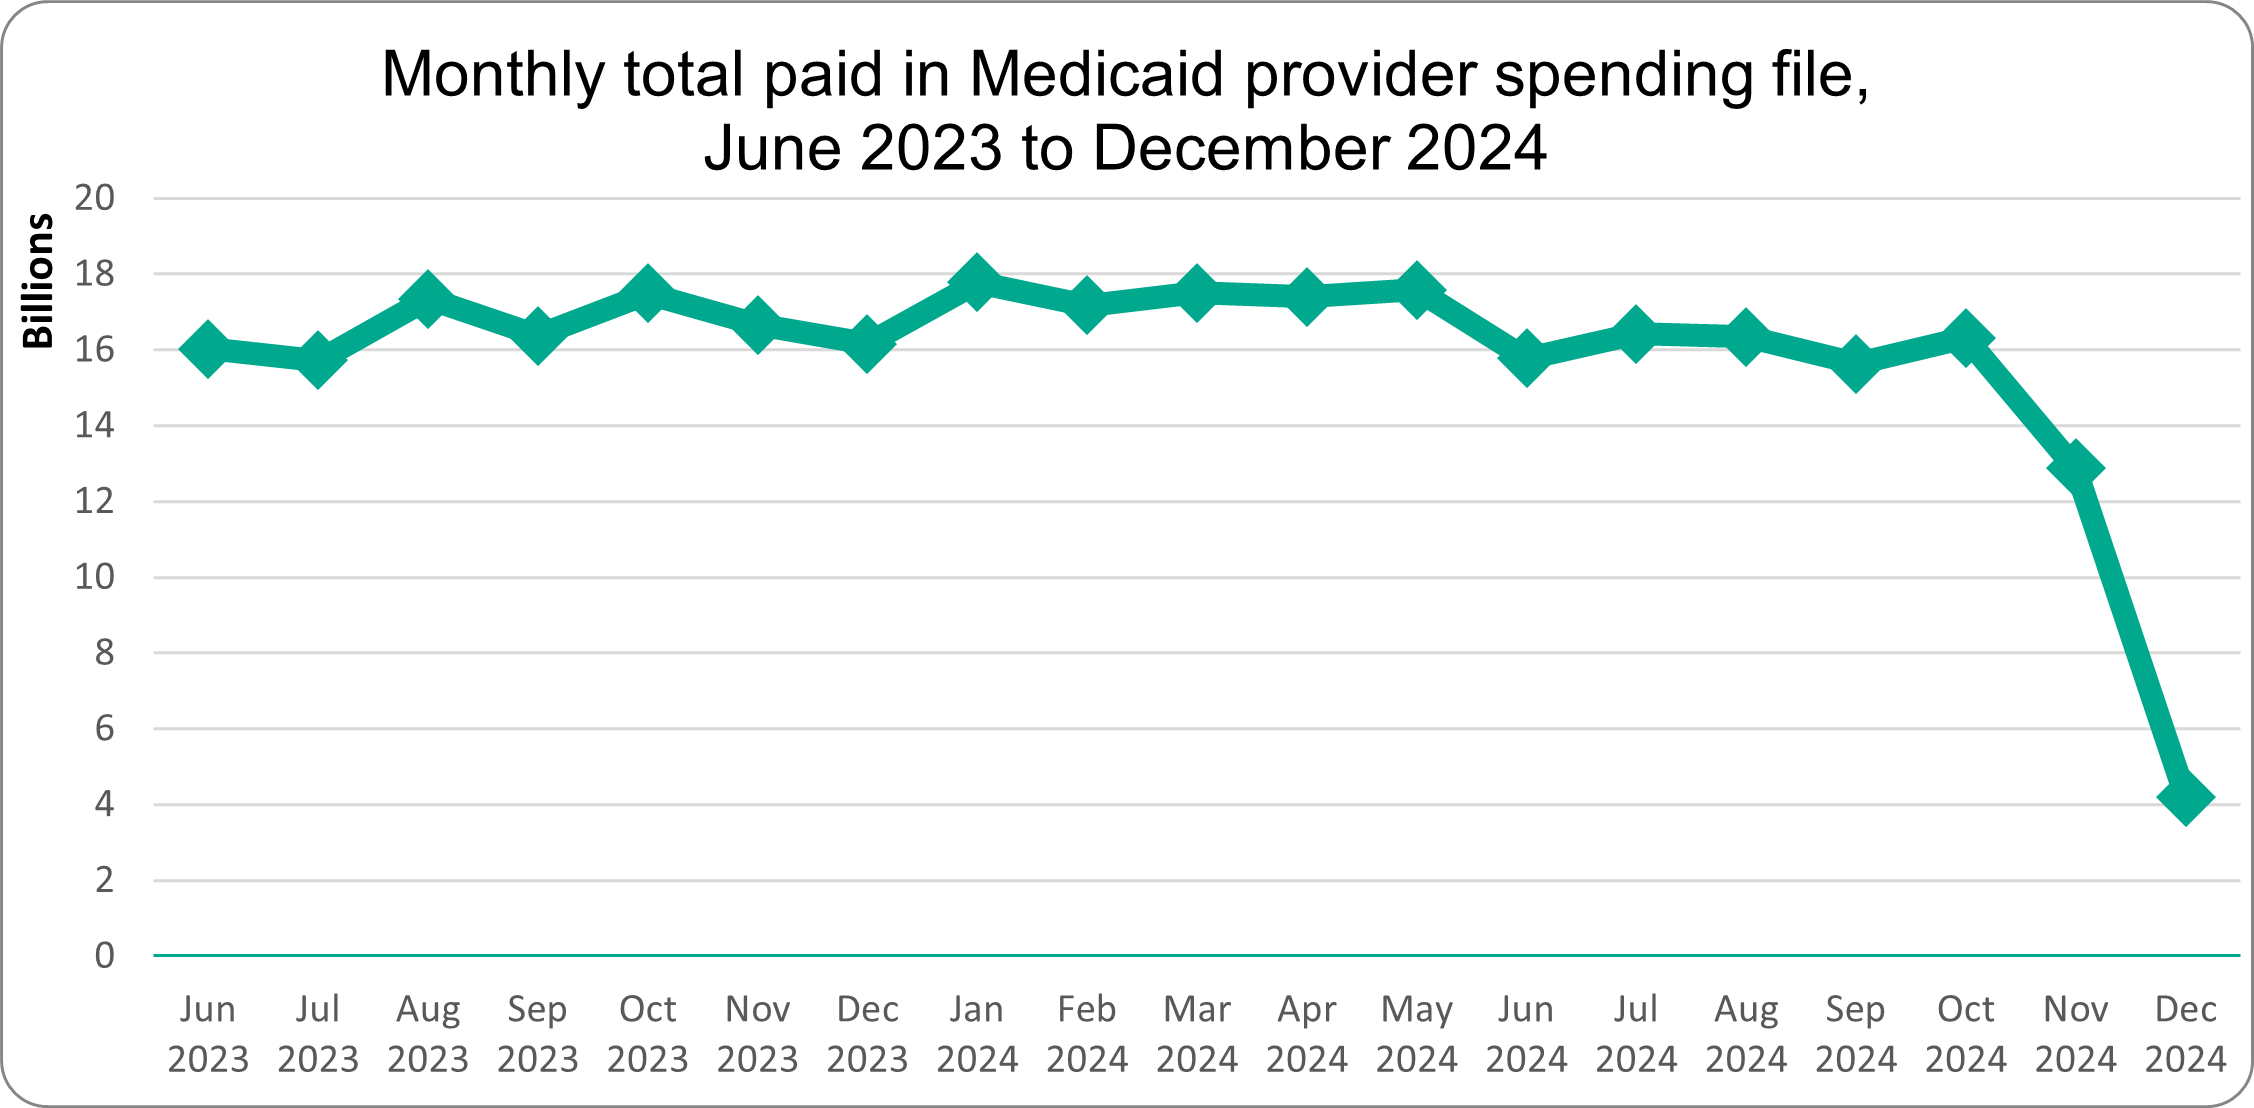
Source: M+ analysis of Medicaid provider spending dataset, HHS (released February 2026)
Managed care encounter data gaps
Most Medicaid beneficiaries across the country are now enrolled in managed care plans. Thus, Medicaid managed care encounter data is an important source of provider spending information.
The dataset webpage states that it includes payments from managed care plans, but from our initial analysis, it is unclear whether it includes all such payments. To assess whether the dataset includes managed care encounter data, M+ merged the dataset with NPI practice address data to approximate state-level paid amounts. This enabled us to compare total dollars paid in each state by using the practice addresses of the billing provider NPIs. We note that the billing provider NPI practice address is an imperfect proxy for site of service, particularly for multi-state provider organizations or entities with centralized billing structures.*
We noticed some anomalies, particularly when comparing certain states with a high proportion of patients in managed care plans to those that have fewer beneficiaries enrolled in such plans. We found that some states with larger percentages of Medicaid managed care enrollment had less total Medicaid payments than smaller states with lower percentages of Medicaid managed care enrollment.
An example is Utah and Alaska. Utah has a high Medicaid managed care enrollment, while Alaska has no Medicaid beneficiaries enrolled in managed care plans. The table below compares Utah and Alaska beneficiary counts and total provider paid amounts in 2023. Despite having almost 200,000 more beneficiaries, Utah-based providers show $250 million less in total paid amounts than Alaska-based providers.
Utah and Alaska (2023)
| Utah | Alaska | Difference between UT and AK | |
|---|---|---|---|
| Number of Medicaid beneficiaries | 451,594 | 256,483 | Utah had almost 200,000 more beneficiaries in 2023 |
| Total provider paid amount in Medicaid provider spending data | $703,747,376 | $964,719,670 | Utah providers were paid $250 million less in 2023 |
| % of Medicaid beneficiaries enrolled in comprehensive managed care | 77.1% | 0% | 77.1% versus 0% managed care enrollment |
Source: CMS report “Medicaid Managed Care Enrollment and Program Characteristics 2023” and M+ analysis of Medicaid provider spending dataset, HHS (released February 2026)
One plausible structural explanation is incomplete capture of managed care encounter claims in high-penetration states such as Utah. Another possible explanation is broader data incompleteness in Utah’s source files: the DQ Atlas categorizes Utah as “high concern” for “linking claims to providers” in its T-MSIS data. Differences in total paid amounts across states can also reflect variation in reimbursement rates and service mix, in addition to differences in reporting practices. Both state payment policy and data completeness should be considered when comparing Medicaid data across states.
*As an aside, as a longtime fan of analyzing Medicaid data, Anthony wishes that the data would include a beneficiary state variable. Using the billing provider NPI’s practice address is a flawed proxy. A beneficiary state variable, which would indicate the state from which the data was derived, would be helpful in all kinds of analyses. And since the data is all aggregated from state-level files, it would seem feasible to include. Here’s hoping for it in the next update!
Since the release of the dataset, various independent analysts have used the dataset to claim potential fraud based on observed outliers. Outliers are often appropriate starting points for inquiry. However, several frequently cited metrics are insufficient without additional information.
Payment per claim
Some analyses flag providers with unusually high “payment per claim” compared to peers. However, this dataset does not include units, dates of service, or claim line detail. It reports only total paid amounts and total claim counts. Claim counts alone are not a reliable measure of service volume. The same care pattern can produce very different claim counts depending on billing practices – for example, whether multiple dates of service are submitted on one claim or on separate claims. As a result, comparing providers based on “payment per claim” or high claim volume can be misleading, since differences in billing conventions may drive the numbers rather than true differences in the cost or quantity of services delivered.
Year-over-year growth
High growth in total paid amounts has also been cited as a signal of potential fraud. However, growth may reflect:
Year-over-year revenue growth may not, by itself, be evidence of improper billing.
Overall, the newly released data can help identify outliers and unusual billing patterns, but given its limitations, stakeholders don’t have enough information here to establish fraud, assess medical necessity, or evaluate unit-level reimbursement rates. Fraud determinations require claim line detail, medical records, and investigative authority, which are functions that reside with state Medicaid agencies and Medicaid Fraud Control Units. Public data can surface anomalies, but it cannot substitute for formal investigation.
This release will enable more transparency around provider service utilization and allow for market research. At the same time, users should recognize important structural limitations, including:
When interpreted appropriately, the dataset offers meaningful insights into Medicaid professional and outpatient service markets. When interpreted superficially, it risks generating misleading conclusions.
The M+ team is continuing to work to make sense of it all. For questions about the dataset, its limitations, or its strategic implications, please reach out!
Until next week, this is Jeffrey (and Anthony) saying, enjoy reading regs with your eggs.
For more information, please contact Jeffrey Davis. To subscribe to Regs & Eggs, please CLICK HERE.